

Next: The SEC Model for
Up: Results of Simulating the
Previous: The SSU Noise Model
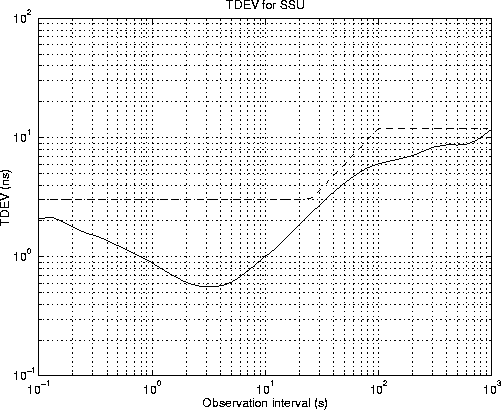
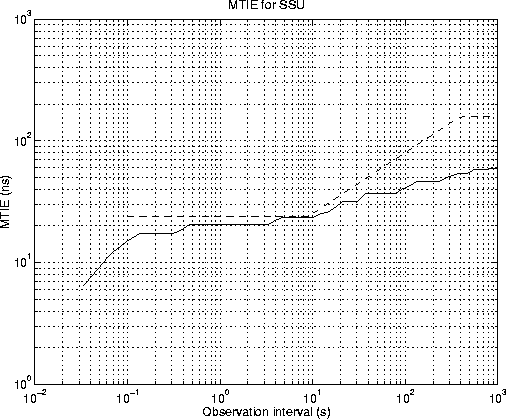
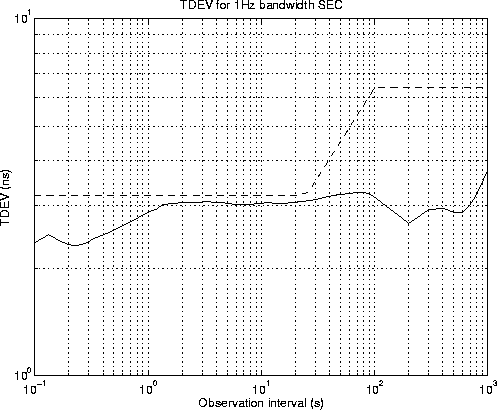
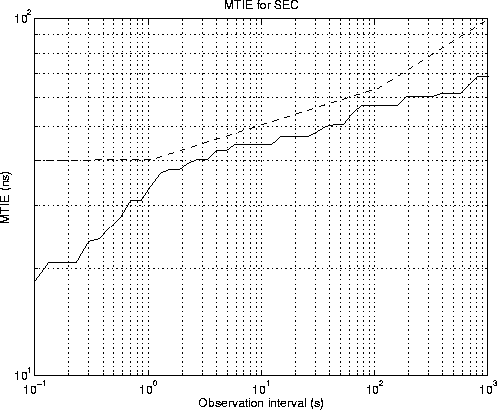
Adopting the values Kf=1425 and Kw=3.0 for an SDH Equipment Clock of bandwidth B=1Hz resulted in TDEV and MTIE figures that lay below the masks. This is in contrast with the value Kf=2977 proposed in [14] which was found to be too high. Data for the 1Hz SEC model is shown in figures 8.3 and 8.4. Equivalent data for a 10Hz bandwidth SEC are shown in figures 8.5 and 8.6. The rather different shape of the TDEV curve for the SEC's compared to the plot for a Synchronisation Supply Unit in figure 8.1 is because the SEC mask does not reflect the asymptotic behaviour a SDH Equipment Clock as described in 6.4.1. This means that a very low flicker phase noise clock has to be specified in order for the clock to satisfy the mask.
Figure 8.3:
TDEV produced by 1Hz SEC model satisfying wander mask
 |
Figure 8.4:
MTIE produced by 1Hz SEC model satisfying wander mask
 |
Figure 8.5:
TDEV produced by 10Hz SEC model satisfying wander mask
 |
Figure 8.6:
MTIE produced by 10Hz SEC model satisfying wander mask
 |


Next: The SEC Model for
Up: Results of Simulating the
Previous: The SSU Noise Model
Mark J Ivens
11/13/1997
