

Next: Verifying the Correct Simulation
Up: Simulating a Maximum Reference
Previous: Simulating a Maximum Reference
The noise filtering characteristic of Synchronisation Supply Units can clearly be seen in figure 8.16. the graph plots the wander before and after the last Synchronisation Supply Unit. It can be seen that the plots are essentially the same for  , but below this interval, the noise is strongly attenuated. It can be seen why the masks are not specified for observation intervals less than 0.1s as any noise will be strongly rejected by subsequent clocks.
Figure 8.16:
Wander in TDEV at input & output of last SSU
 |
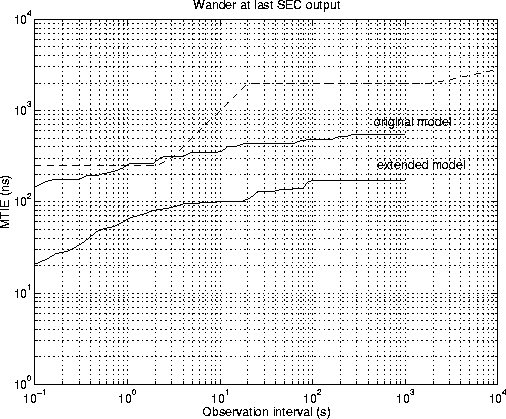
The same filtering property can be seen in the MTIE data in figure 8.17.
Figure 8.17:
Wander in MTIE at input & output of last SSU
 |
Mark J Ivens
11/13/1997
