

Next: Testing Filter A
Up: Verifying the Correct Simulation
Previous: Verifying the Correct Simulation
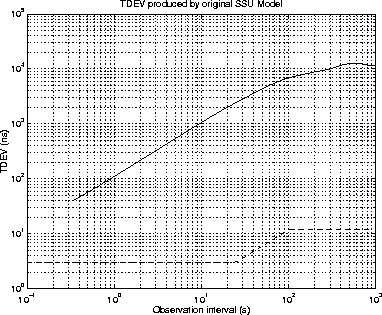
Shown in figure 8.18 are early results for the TDEV produced by one Synchronisation Supply Unit.
Figure 8.18:
Early results for the TDEV produced by one SSU highlighting a problem
 |
It can be seen that the TDEV curve lies significantly above the mask. It was decided that to investigate the nature of the problem and subsequently that the output of the two individual branches would be examined. The SPW block diagram utilised is shown in figure 8.19.
Figure 8.19:
Block diagram of simulation used to test initial SSU model
 |
The TDEV produced by the top and bottom branches are shown in figure 8.20.
Figure 8.20:
TDEV produced by top and bottom branches of the initial SSU model
 |
From the figure it can be seen from the magnitudes of the two curves as well as the fact the output from the top branch (the x's in the plot) follows the output of the whole model (the solid line) that the top branch is swamping the bottom (shown by the o's) with noise at a far too high a level. After checking that all the parameters were correctly set it was decided to test filter A on its own.


Next: Testing Filter A
Up: Verifying the Correct Simulation
Previous: Verifying the Correct Simulation
Mark J Ivens
11/13/1997
