


Next: Theoretical Analysis of the
Up: Verifying the Correct Simulation
Previous: Evidence of a problem
It was decided to feed the usual 5Hz noise bandwidth white gaussian noise into filter A and measure the TDEV of the noise produced at its output. The block diagram for this is shown in figure 8.21.
Figure 8.21:
System considered to test simulation of Filter A
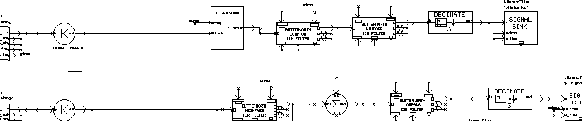 |
In order to be able to ascertain the correct behaviour of filter A, it was necessary to obtain a theoretical prediction for the TDEV at the output of the system shown in the figure.
Mark J Ivens
11/13/1997