

Next: Implementing the 5Hz Noise
Up: Basic Model of One
Previous: Basic Model of One
The simulation of filter A in the ETSI noise model, depicted as the block flickerphase in figure 7.3 will now be discussed. The transfer function for filter A in the noise model (2.1) can be expressed as
|  |
(57) |
The two terms inside the brackets of (7.1) clearly correspond to first order Butterworth low and high pass filters. Thus each term of the form

is equivalent to a cascaded  gain element and a low pass and high pass filter each with passband edges
  . Thus Filter A with the transfer function (2.1) can be modelled as a cascade of eight such low pass, high pass and gain elements.
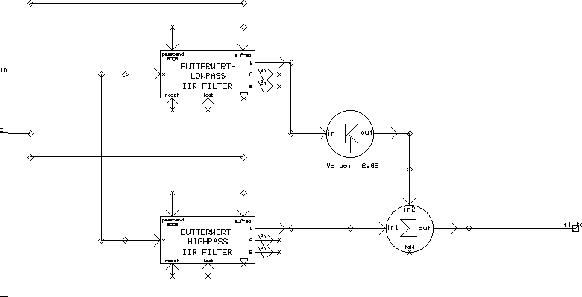
Figures 7.4 and 7.5 show the topology of the filter A block in SPW. Figure 7.4 shows a cascade of 8 blocks each labelled unitfilt followed by a  gain element. Each unitfilt block is actually a low pass, high pass and
  gain element. A typical unitfilt block is shown in figure 7.5. The passband edges for the Butterworth low and highpass filters in the cascade of eight unitfilt blocks take the values 6.72,
  , ...,
  Hz.
Hz.
Figure 7.4:
Block diagram showing cascade of unitfilt blocks used to simulate filter A
 |
Figure 7.5:
Block diagram of an individual unitfilt block from fig. 7.4
 |


Next: Implementing the 5Hz Noise
Up: Basic Model of One
Previous: Basic Model of One
Mark J Ivens
11/13/1997


![]() gain element. Each unitfilt block is actually a low pass, high pass and
gain element. Each unitfilt block is actually a low pass, high pass and ![]() gain element. A typical unitfilt block is shown in figure 7.5. The passband edges for the Butterworth low and highpass filters in the cascade of eight unitfilt blocks take the values 6.72,
gain element. A typical unitfilt block is shown in figure 7.5. The passband edges for the Butterworth low and highpass filters in the cascade of eight unitfilt blocks take the values 6.72, ![]() , ...,
, ..., ![]() Hz.
Hz.
