

Next: Extending the Model
Up: Reducing the File Size
Previous: Reducing the Simulation time
A similar approach to that described in 7.2.1 was tried in order to reduce the simulation and post-processing time for MTIE. Unfortunately it was found, as shown in section 8.5, the MTIE employing a SPW decimate block affected the results considerably.
This may be because the transfer function for MTIE which, from equation (4.11) is given by

does not have the high-pass filtering characteristic possessed by TDEV as is evident from the denominator of the approximated TDEV transfer function (4.8)

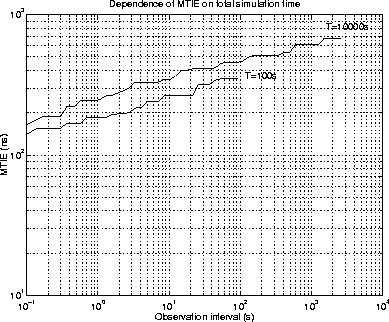
Given that the approach used to calculate TDEV could not be followed, it was most fortuitous that the condition that the simulation time must be at least 12 times the longest observation interval being calculated did not apply. In actual fact, it was found that as might be expected, a longer total simulation time resulted in the MTIE curve being shifted upwards. This is shown in figure 7.7. The data is for the worst case SSU output reference for the unextended ETSI model (i.e. without the PLL noise filtering being taken into account.
Figure 7.7:
MTIE for 100s and 10000s simulation time
 |
It can be seen that is would be perhaps a good idea to implement the  condition for MTIE as well as TDEV. Since it was not possible to decimate the data, implementing such longer simulation times would be impractical given the computer resources available. Calculating MTIE data for simulation runs of 10000s at a 30Hz sampling frequency took significantly over 12 hours on a SPARC 10 as well as utilising considerable storage space. For this reason, the strict letter of the standard was adhered to.
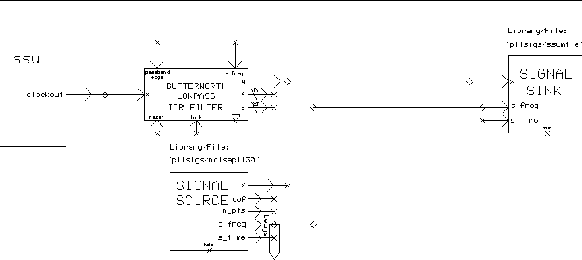
The set up used for collecting data for MTIE measurement is shown in figure 7.8.
Figure 7.8:
SPW block diagram of system for collecting data for SSU MTIE calculation
 |
The methodology is similar to that used when calculating TDEV except the 30Hz sampling frequency can be also used at the input of the signal sink and no decimation is used.


Next: Extending the Model
Up: Reducing the File Size
Previous: Reducing the Simulation time
Mark J Ivens
11/13/1997


