

Next: Post Processing to Obtain
Up: Implementing the Model
Previous: Extending the Model
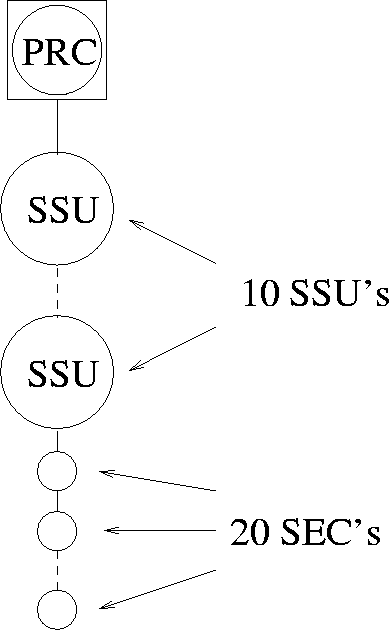
One of the project aims was to model individual synchronisation clocks and to verify that they do not exceed the network limits for wander when in a maximum reference chain as discussed in section 2.2.1. Recall that the reference chain is defined as follows. It consists of K Synchronisation Supply Units, each linked by N SDH equipment clocks. The values of K and N have been provisionally set [2] at K=10 and N=20 with the provision that the total number of SDH Equipment Clocks is limited to 60. There are several ways that this reference chain could be implemented. The approach adopted was to distribute the 60 SEC's relatively uniformly throughout the chain: i.e. 5 SEC's between each SSU and between the PRC and first SSU. This leaves 5 SEC's which were placed at the end of the chain. This is depicted in figure 7.11.
Figure 7.11:
Variant of reference chain simulated
 |
A chain of five of the extended model SDH Equipment Clock blocks were cascaded together for convenience.
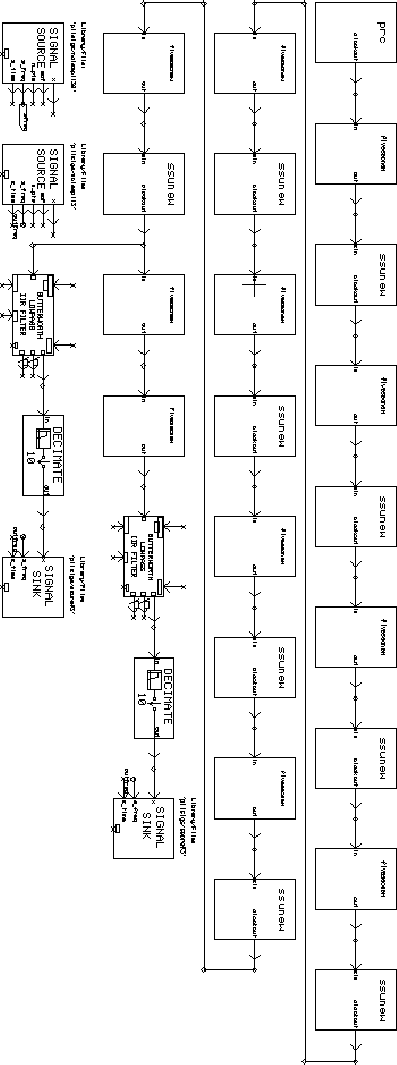
The block diagram for the collection of data for TDEV calculation using the extended model is shown in figure 7.12. The blocks entitled ssunew and fivenewsec are the extended SSU and cascade of five extended SEC models respectively.
Figure 7.12:
SPW block diagram of reference chain--extended model
 |
Signal sinks have been placed at the end of the chain and after the last Synchronisation Supply Unit. These obtain data for the SEC and SSU network limits. A similar diagram but without the decimate blocks would result for the calculation of MTIE. Data for the PRC reference is not collected because the masks for the wander generation of a PRC trivially lies below the output reference chain PRC masks. The wander accumulation of a PDH link lies outside the scope of the simulation and has therefore not been measured.
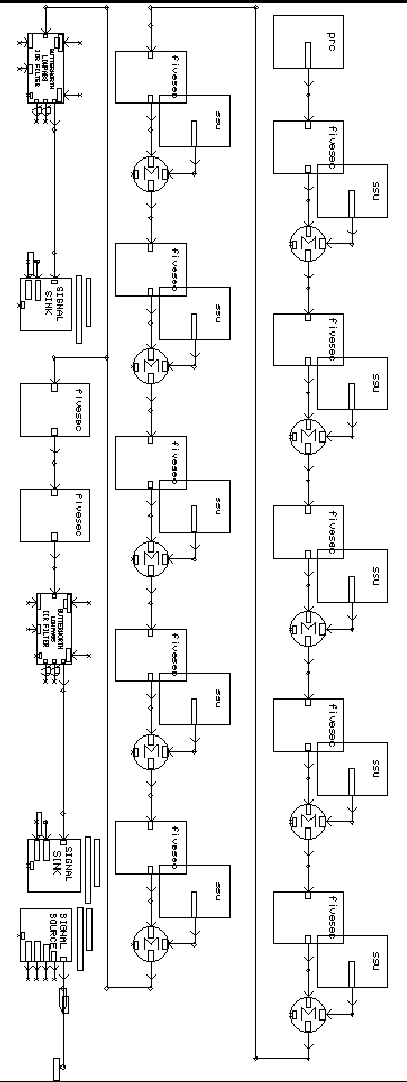
A similar diagram for implementing a reference chain using the original ETSI model is shown in figure 7.13 for collecting MTIE data.
Figure 7.13:
SPW block diagram of reference chain--original model
 |
It can be seen that the chain has been simulated by simply adding the noise produced at the output of each clock. The summation blocks between each clocks are either shown explicitly or are encapsulated inside the fivesec composite blocks.


Next: Post Processing to Obtain
Up: Implementing the Model
Previous: Extending the Model
Mark J Ivens
11/13/1997
